
Sign up & acquisition
Step 01.
The problem
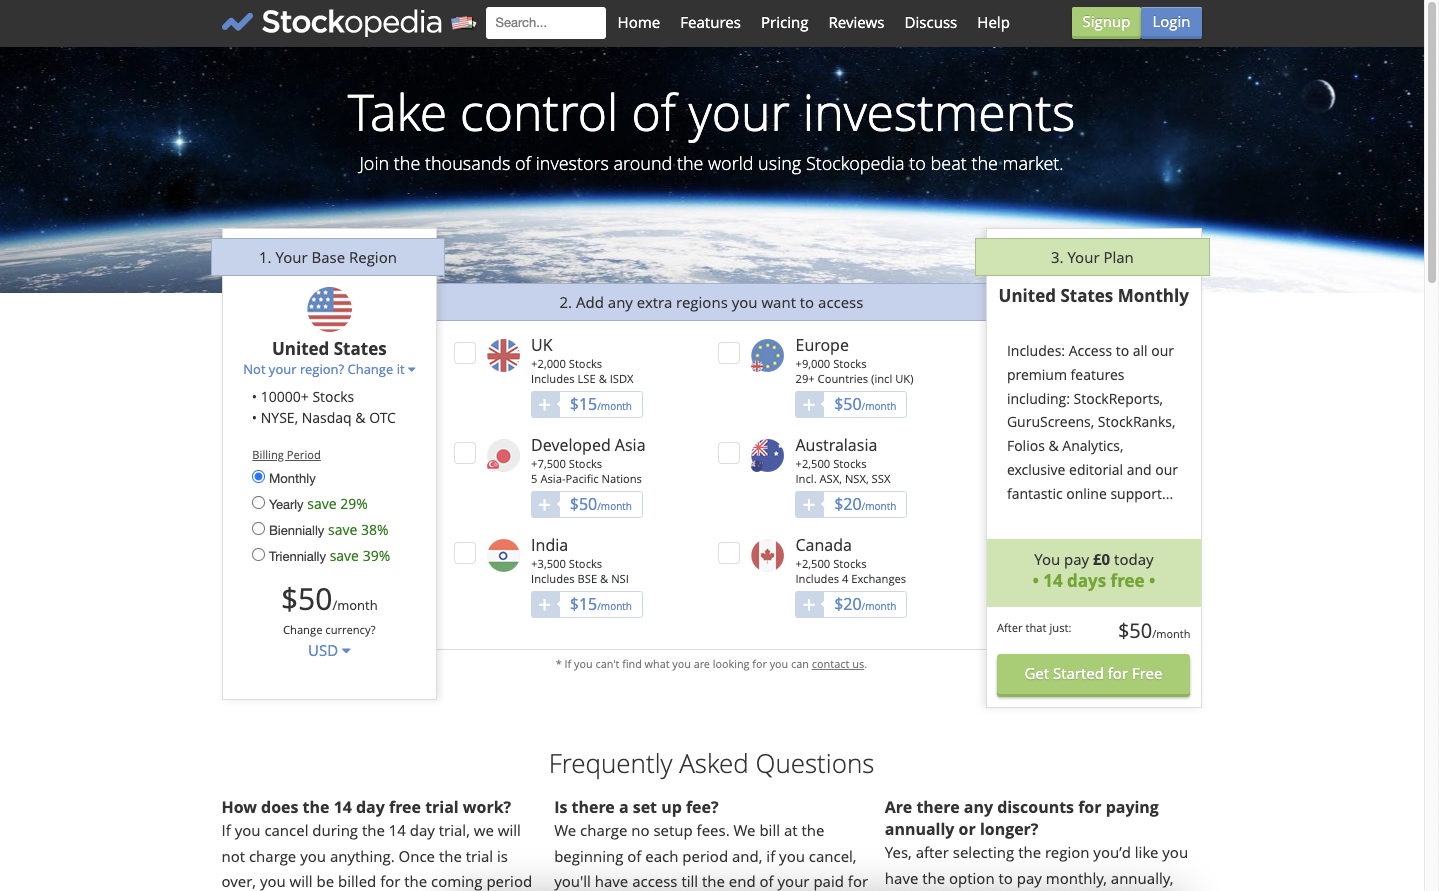
Complex and inconsistent pricing model: The pricing model confuses customers and is technically difficult to maintain.
Need for short-term revenue increase: Long-term, we’d like to introduce tiered plans with more premium features. However, in the short-term we need a strategy to increase average revenue per customer without extensive development work.
Limited upsell opportunities: Currently, the only upsell is additional region coverage. We need to determine if customers are willing to pay more for increased usage limits on key features such as Folios, Screens, and Alerts.
Step 02.
Research
Customer feedback
Several competitors offer global data as standard, making additional regions a difficult upsell.
“I am guessing your target is amateur investors like myself. I think you charge way too much for adding on the other regions. This is short sighted in my opinion. I genuinely loved the web page design, top rate.”
The affordability of our service depends on an individuals investable wealth. Our subscribers’ investable wealth mostly falls between £50k and £2m. Those at the lower end of this bracket tend to be more price sensitive.
“The value of my investments are small relative to price of the service.”
From 10,000 subscriber requests in our feedback database, access to additional portfolios emerged as the 9th most sought-after site enhancement. We found a positive correlation between investable wealth and the number of portfolios created.
“Is there a limit of ten portfolios? Can I increase this? I would love to be able to buy more capacity here. Ten is quite limited for tracking different strategies.”
Usage data
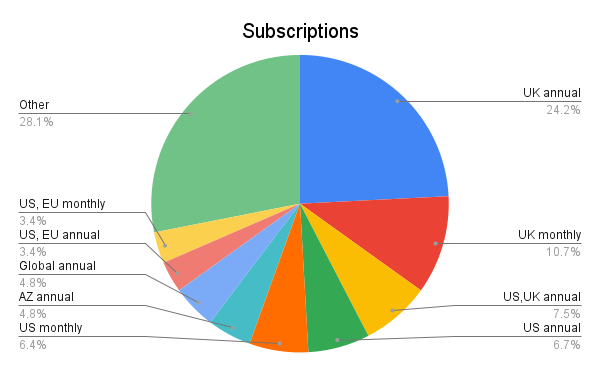
Subscription demographics:Almost 60% of subscribers are on a UK and/or US subscription; 35% UK only, 14% US only, 10% UK + US.
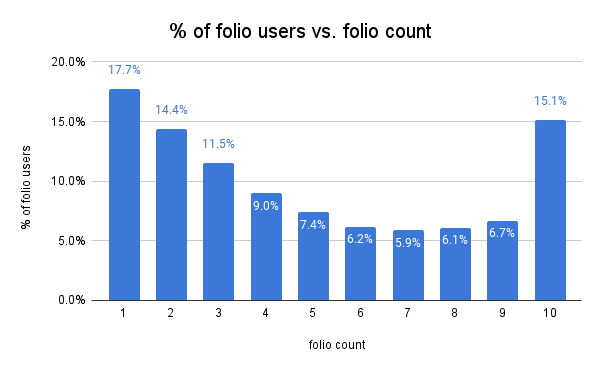
Current usage limits: 13% of Folio users were at the current limit of 10, suggesting pent-up demand for more.
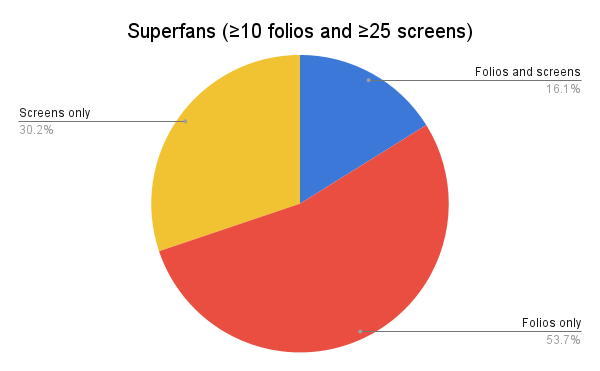
Portfolio and Screener usage: We found minimal overlap (16%) between “super fans” of our Portfolio and Screener tools. This indicated that setting usage limits on these features could maximise uptake of a higher-tiered plan from both cohorts.
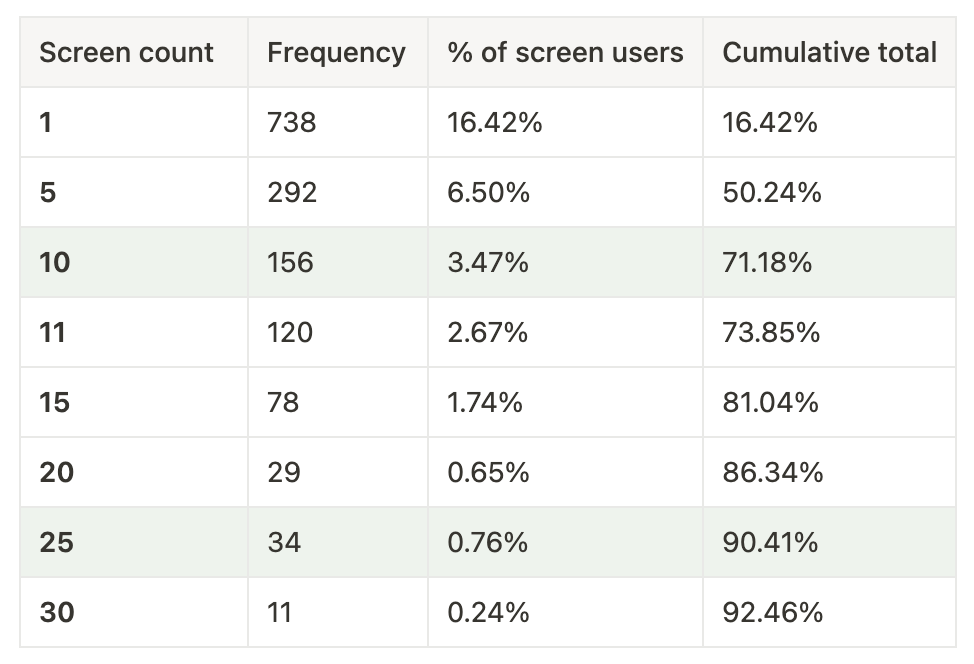
Screen usage analysis: We decided setting limits at 10, 25 and 50 screens would be most appropriate for plan tiering based on usage data.
Step 03.
Ideation & testing
I tested each variant with five participants. Using TryMyUi, I recruited individuals unfamiliar with our service. To ensure they closely matched our target customer profile, each participant completed a screening questionnaire.
Design variant one
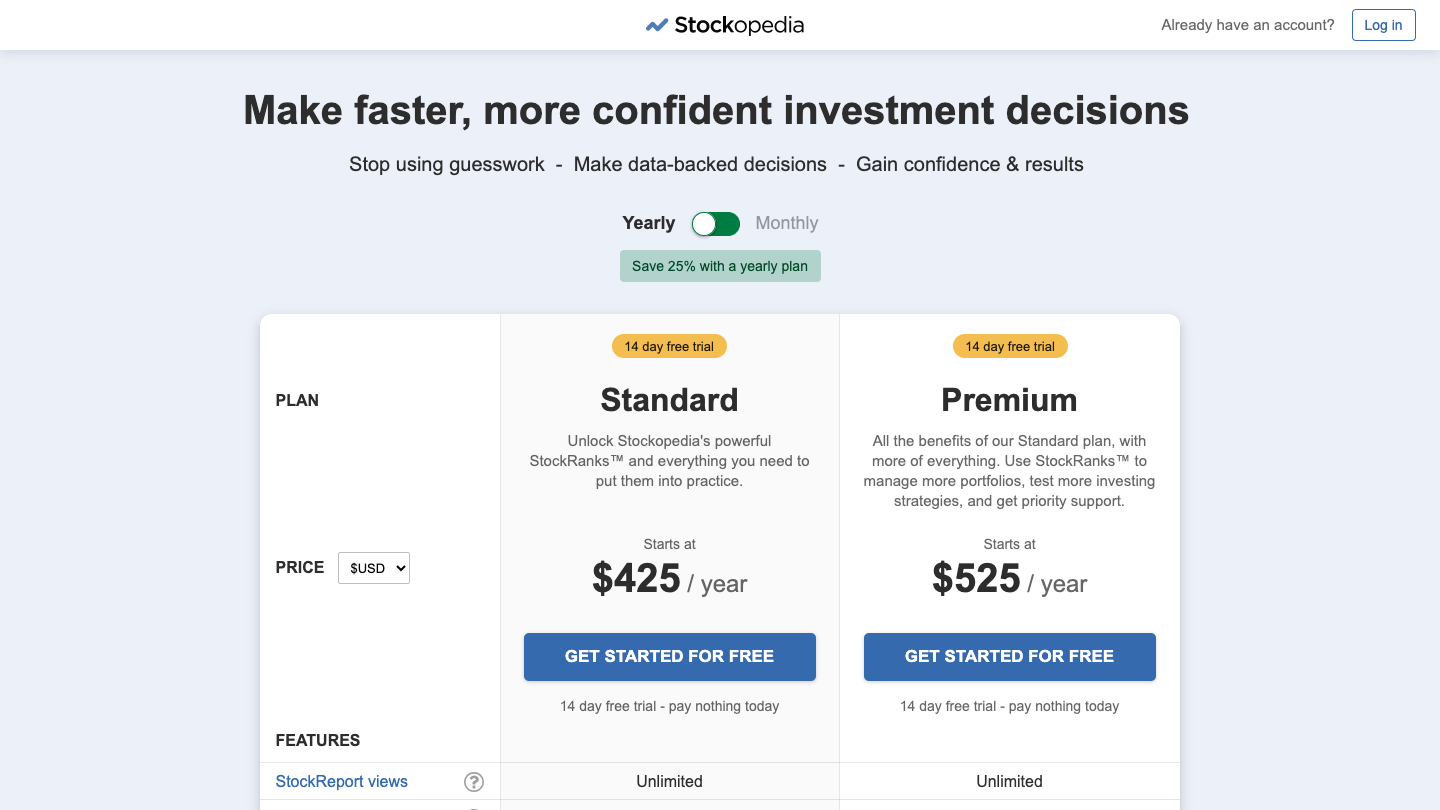
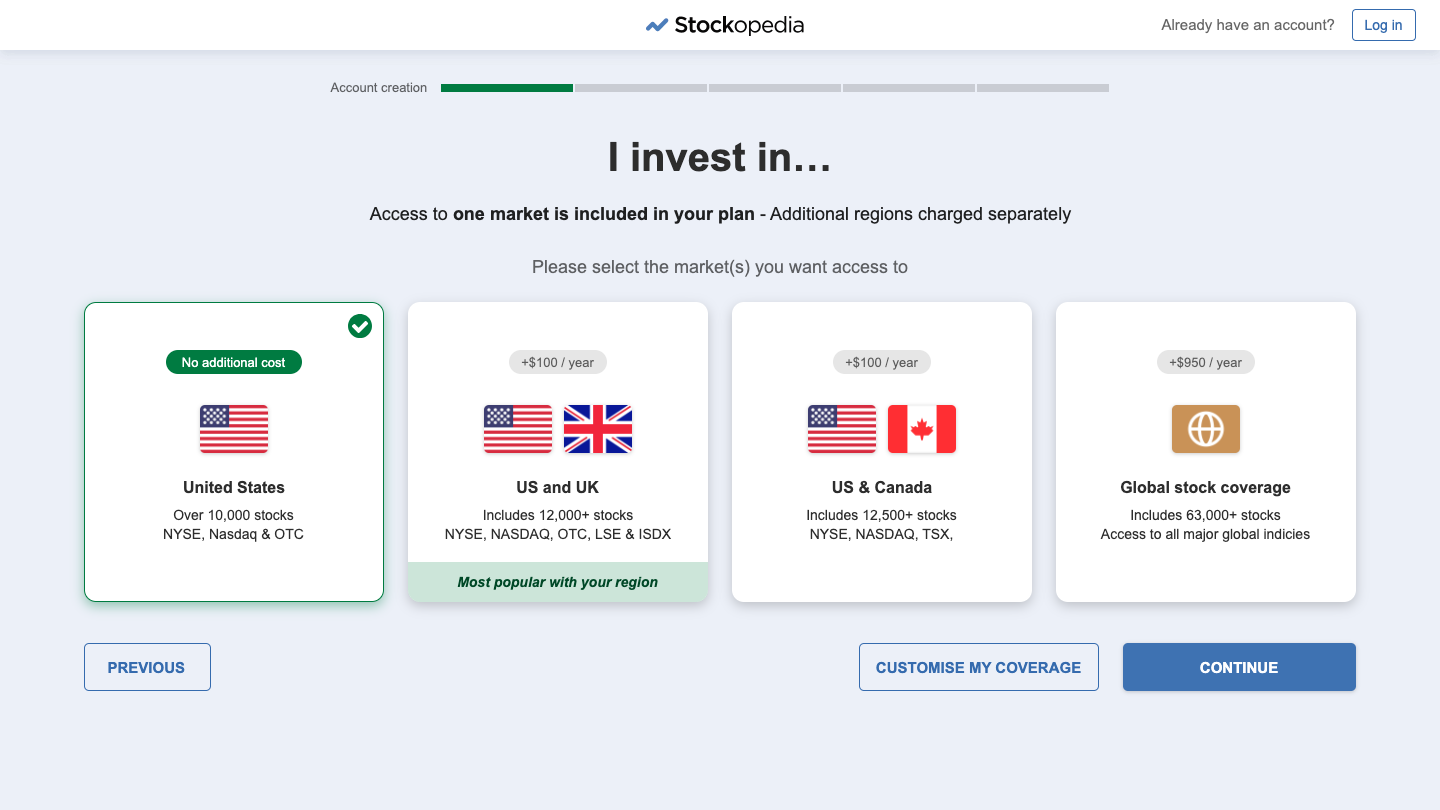
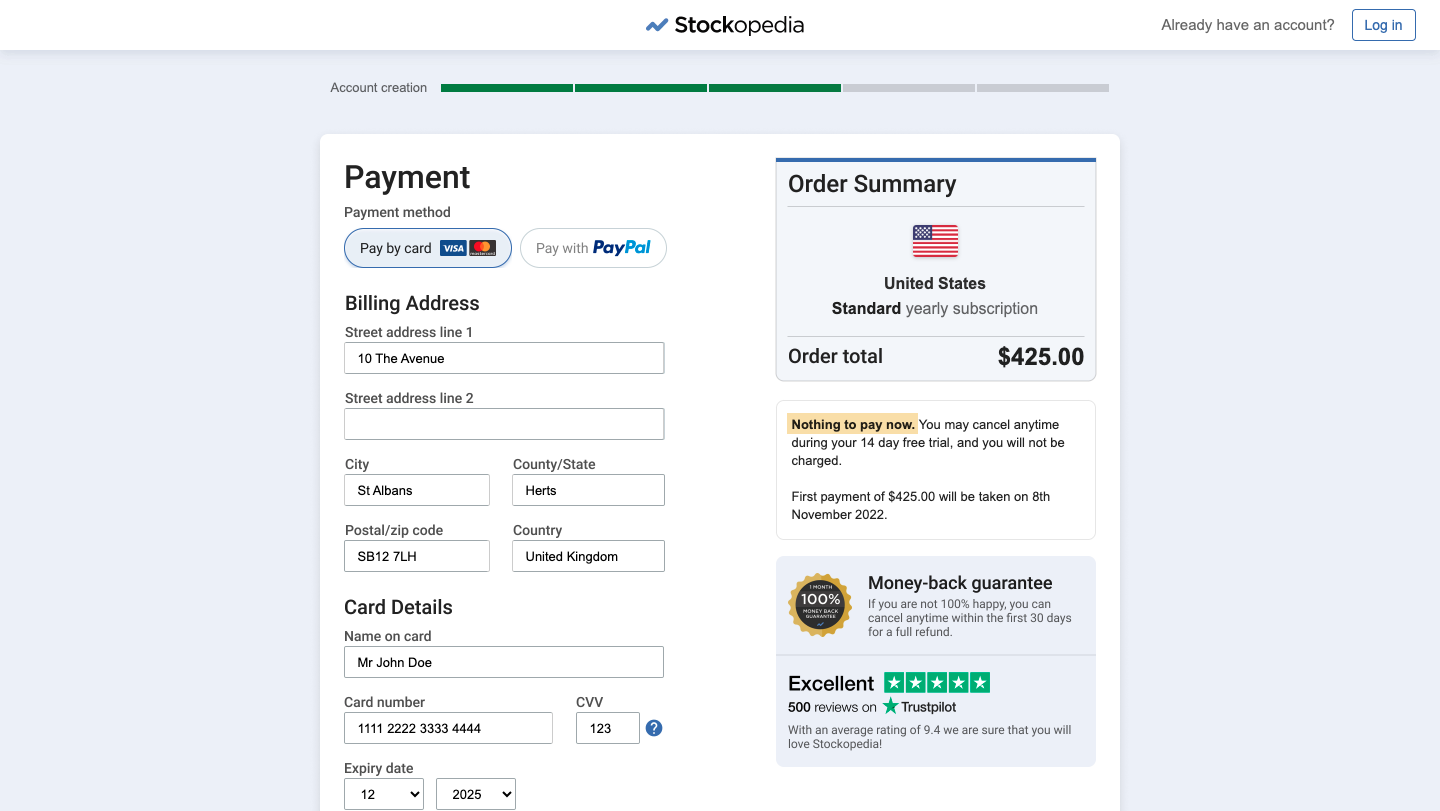
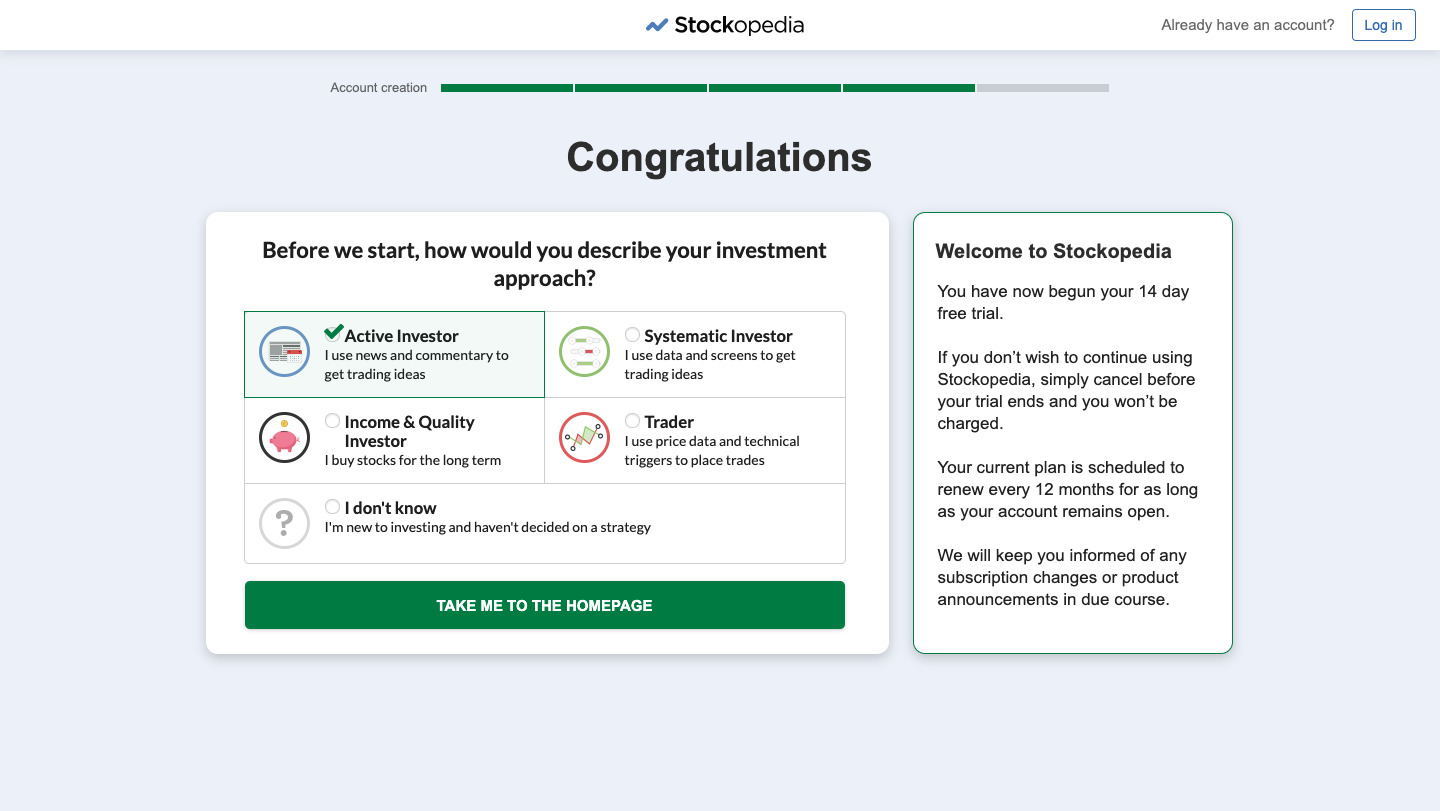
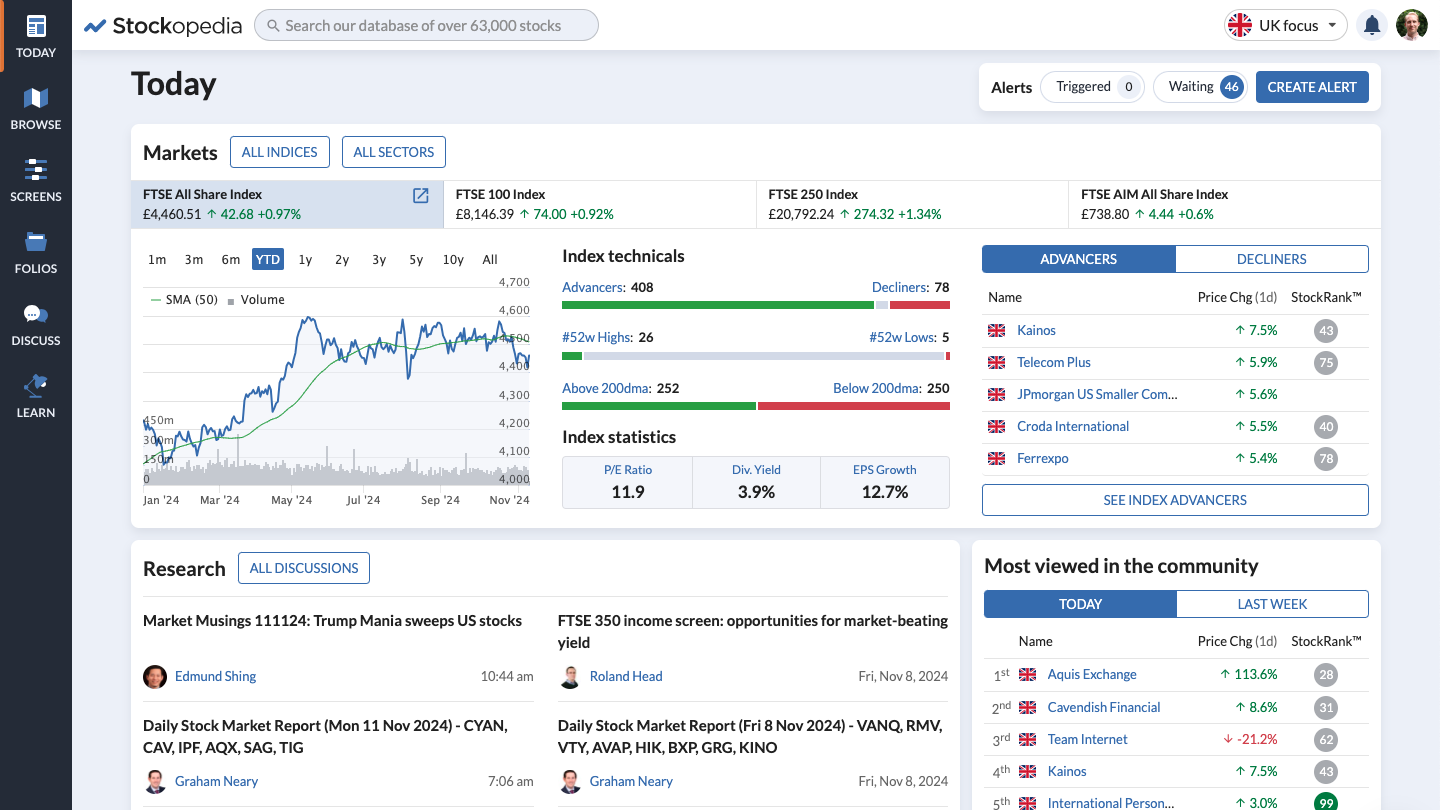
Contained two plan tiers and the value metrics were usage based. Regions were not displayed on the plans page. One region was included in each plan, additional regions were at extra cost.
Key findings
Comparison table: Including a comparison table of product features helped users understand our offering, but didn’t do enough to differentiate us from competitors.
“… there were links to see more about each feature, which I clicked, but they didn’t do a good job of selling it to me. The features weren’t dissimilar from free investment sites. The owner could do more to distinguish why these features are better and worth the money.”
Usage based value metrics: These did not lead any participant to take the higher-tiered plan.
“The tool selection here is very feature rich, and Standard plan is more than I need to get the most out of what I do with stocks.”
Pricing transparency: Participants preferred the transparency of upfront region selection.
“I felt more confident when I could pick other countries at the start – makes me feel like it’s more trustworthy.”
“If I’m adding the US that’s an additional £180? No, I don’t like that. I feel like you are trying to squeeze more money out of me by doing it that way.”
Design variant two
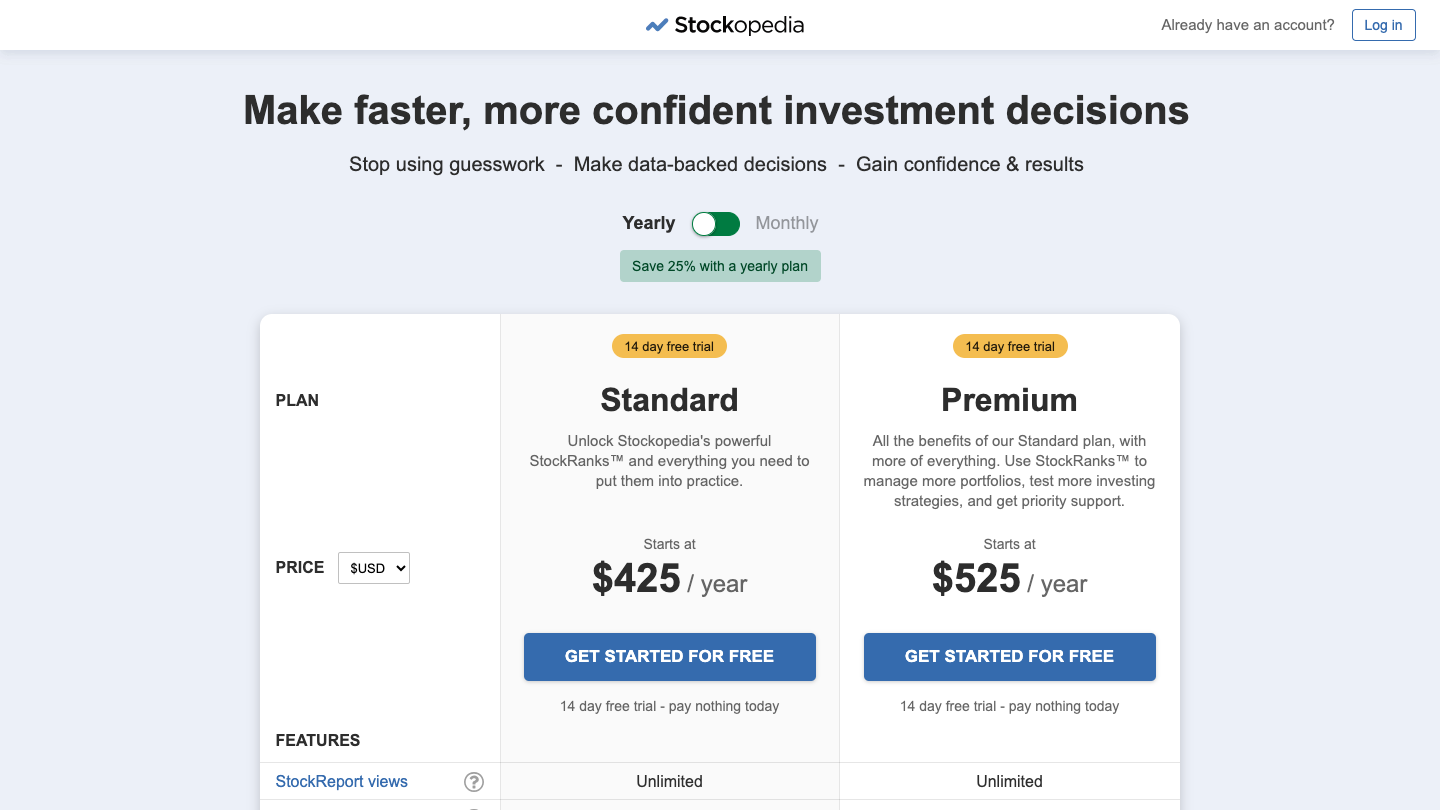
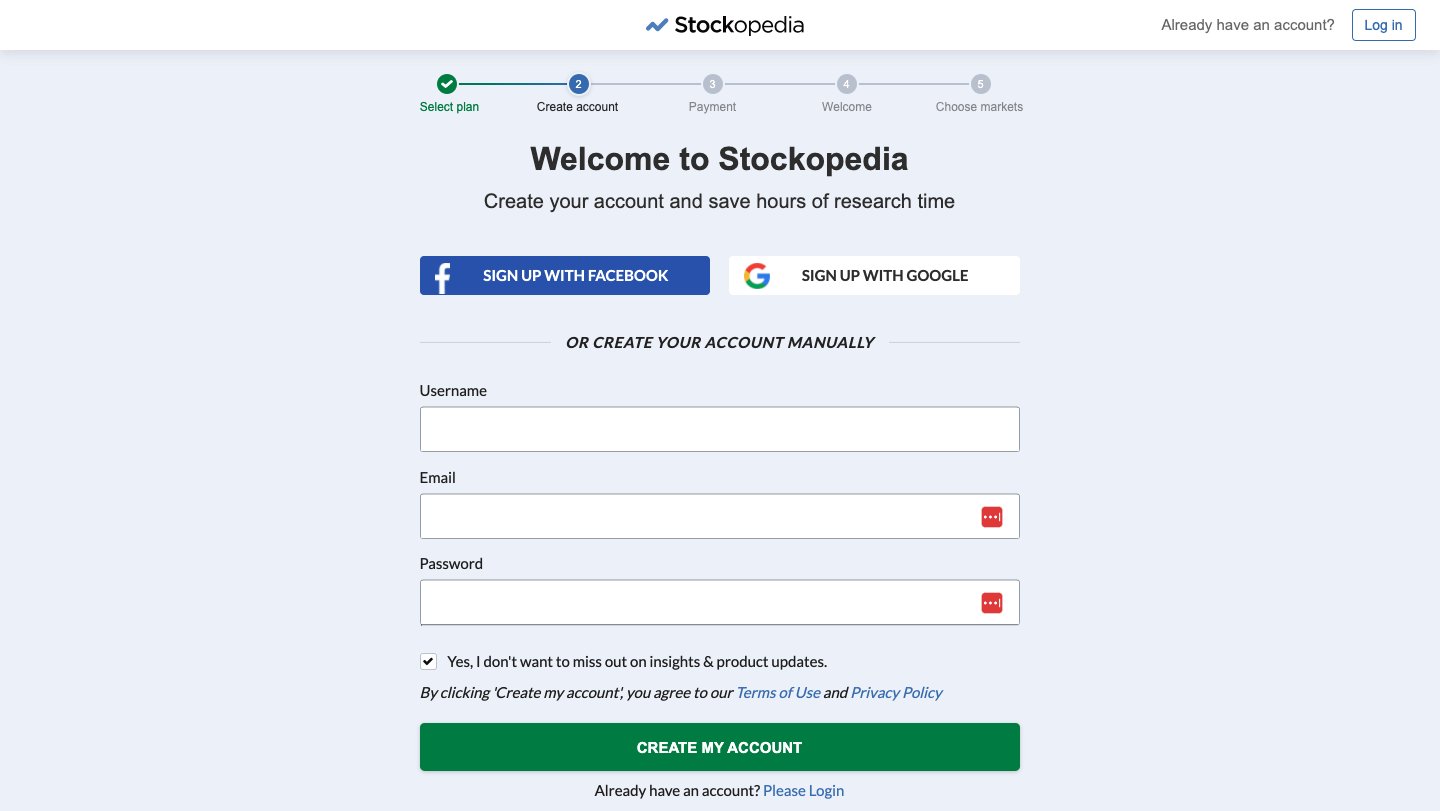
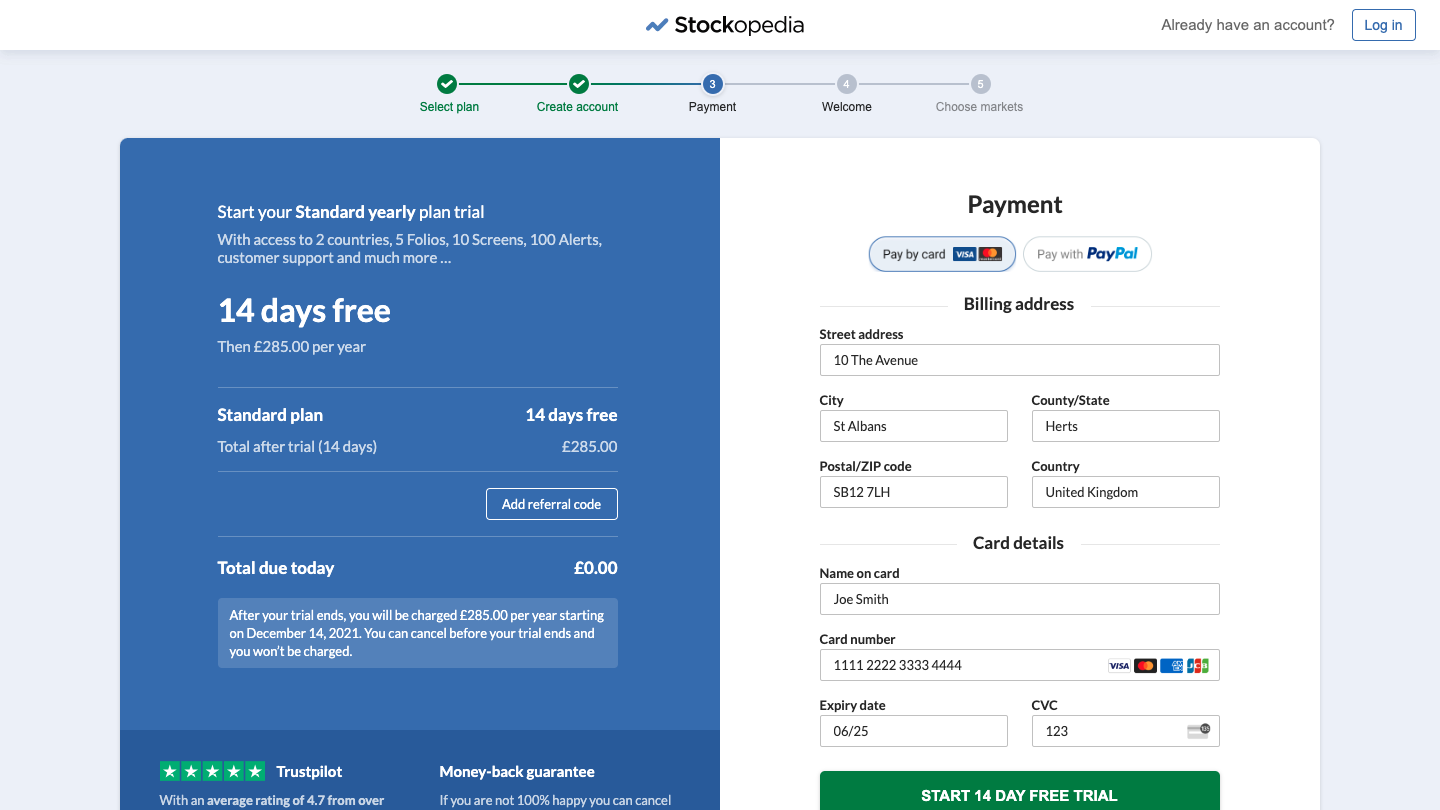
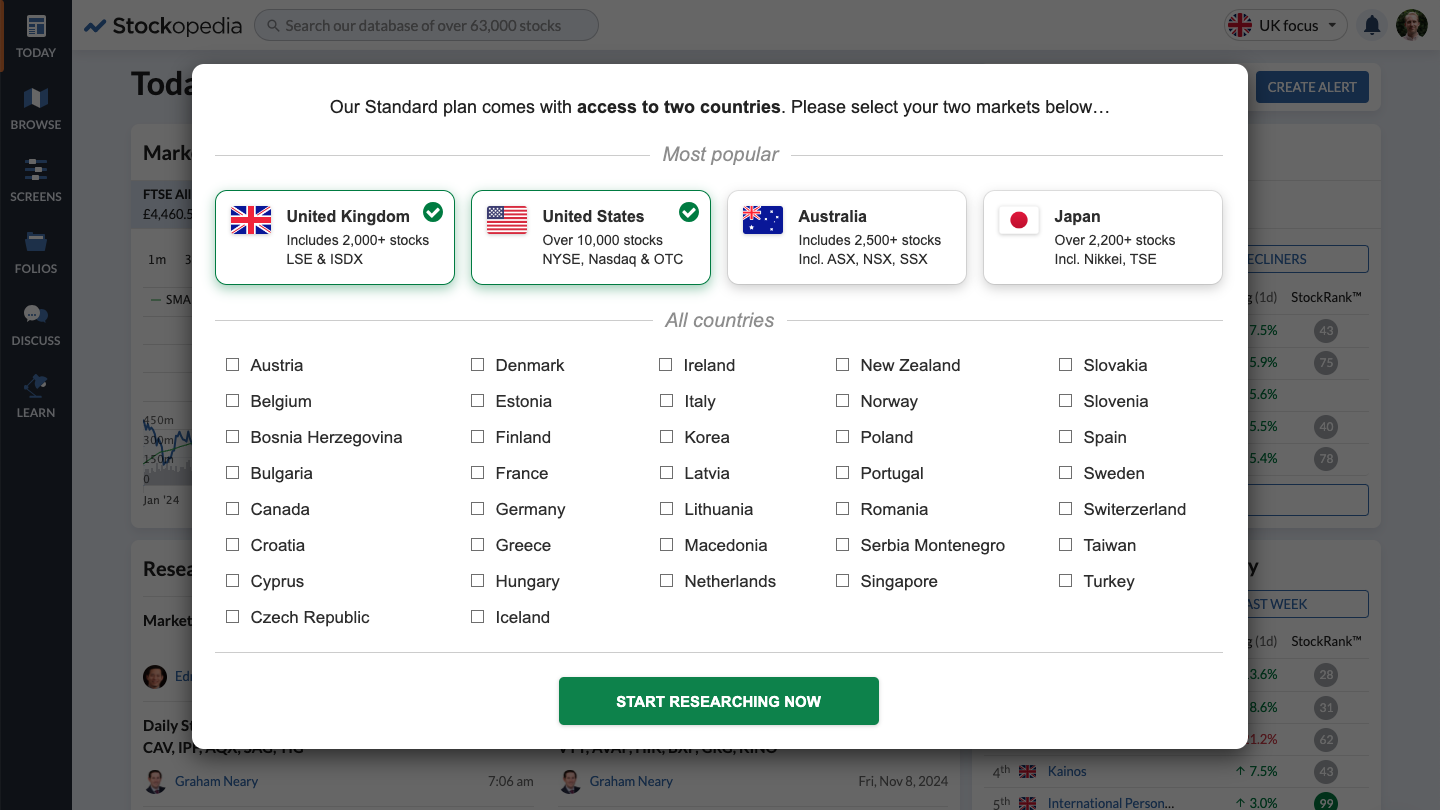
Contained two tiers with usage-based value metrics. The Standard tier included access to two regions; the Premium had global region coverage.
Key findings
Home market bias: All participants chose the lower priced plan due to home market bias. Sample size may have also been a factor.
“United States. That’s pretty much all I need.”
“To start with I would go for the Standard plan at £285, as I predominantly invest in 2 countries anyway. If I needed more, I could upgrade to Premium later.”
“Oh, it would definitely be the Standard, I’m not going to need more than 5 custom portfolios or global coverage. I’m just interested in UK and probably US stocks.”
Usage metrics: Participants were feature focussed, increased usage metrics did not entice them to upgrade.
“Seems like all the tools are pretty much the same … Don’t see the point in spending the extra $300, when I don’t need all these extra things.”
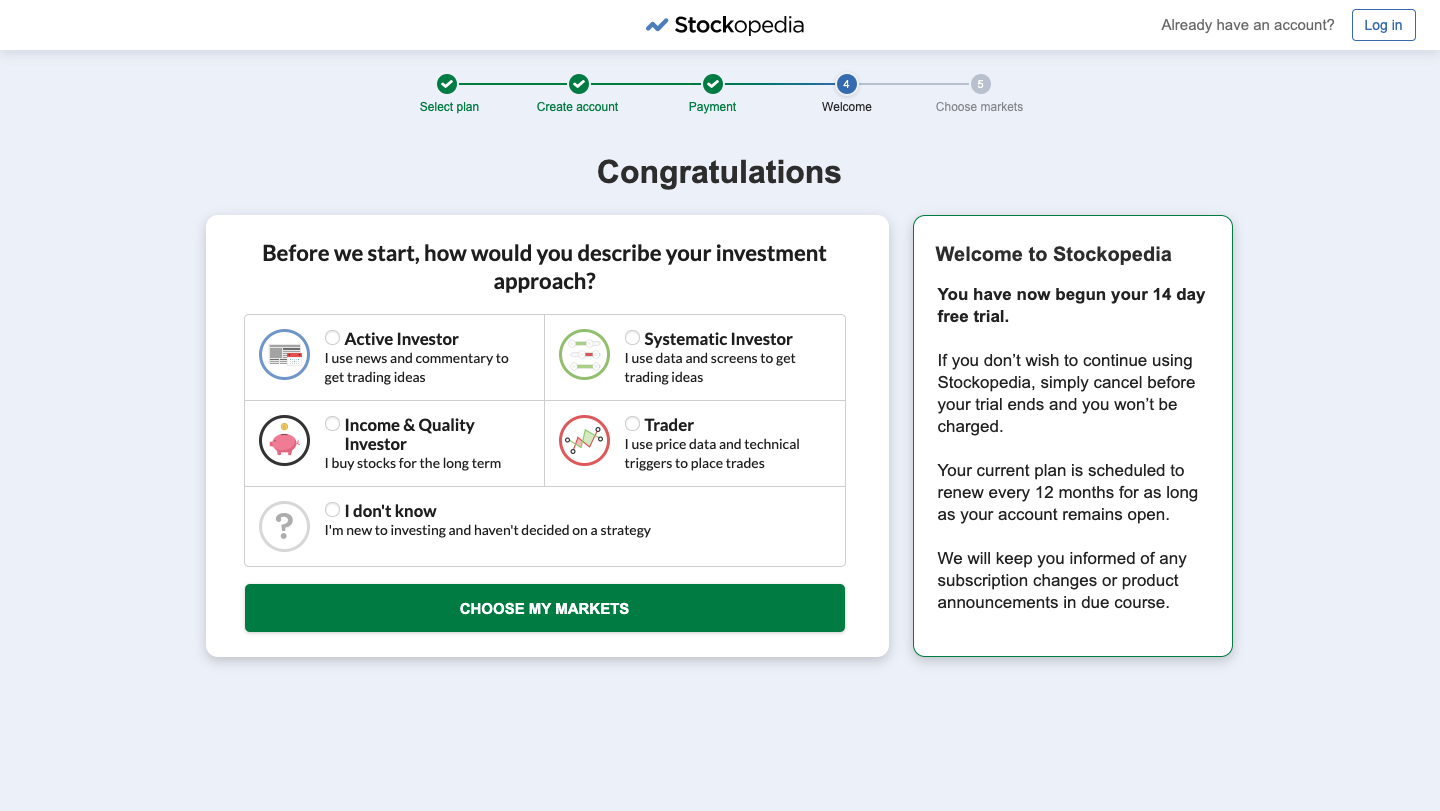
Personalisation: Participants were excited about the prospect of personalisation during sign-up, indicating a large opportunity here.
“I really like this. I didn’t realise that after you choose which type of investor you are, you get to choose what you are interested in. This is really cool! Wow!”
“…Oh! Guess I don’t know what I thought I would see … it’s choose your markets, not choose what stocks for the kind of investor I am. I got that wrong.”
Step 04.
Refinement
- User testing and surveys of subscribers indicated that usage-based limits on key product features would not encourage users to upgrade to a higher-tiered plan.
- Introducing new features into the higher-tiered plan would be well received by customers, but the development would take more than 6 months, so it did not align with the goal of increasing next quarter’s average revenue per customer.
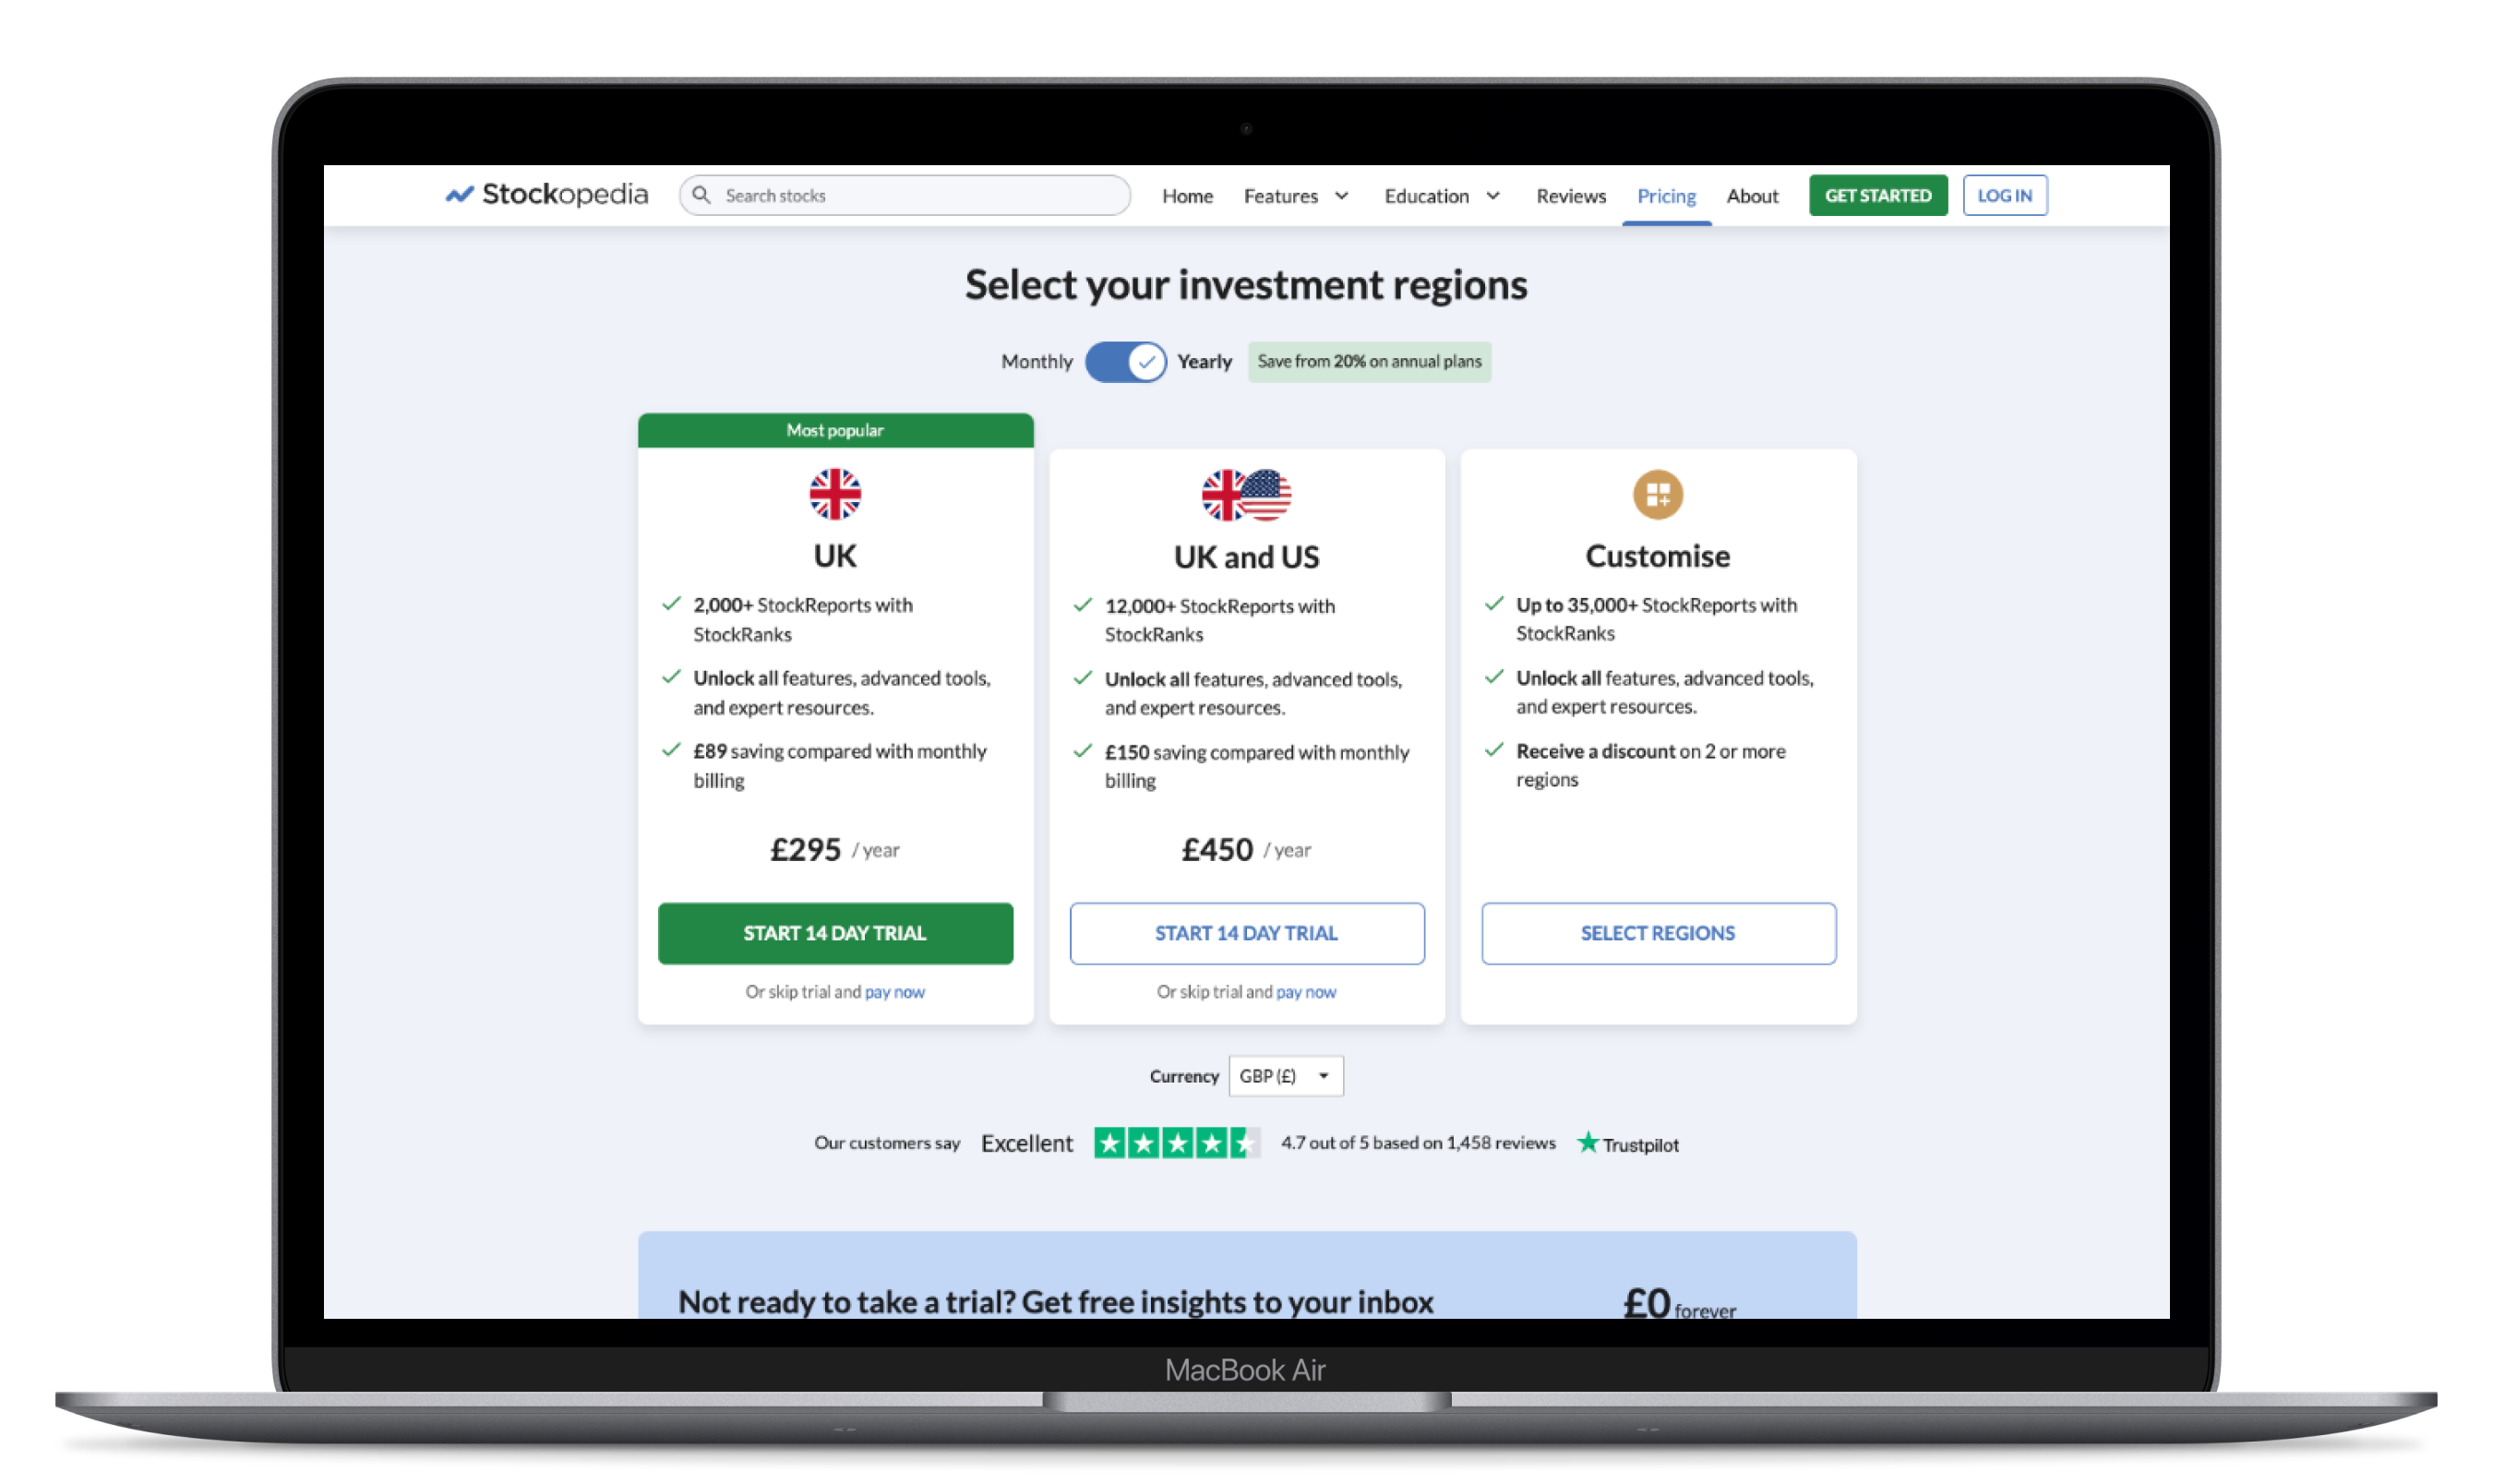
- Most UK-based subscribers exhibit a home market bias, with the US being the most commonly purchased additional region. We focused on simplifying the region pricing, making the UK + US package more affordable.
- We structured the plans into three tiers based solely on regional coverage: UK in the base tier, UK + US in the mid-tier, and Global in the top tier. By promoting the UK + US plan, we aimed to increase mid-tier adoption and average revenue per customer.
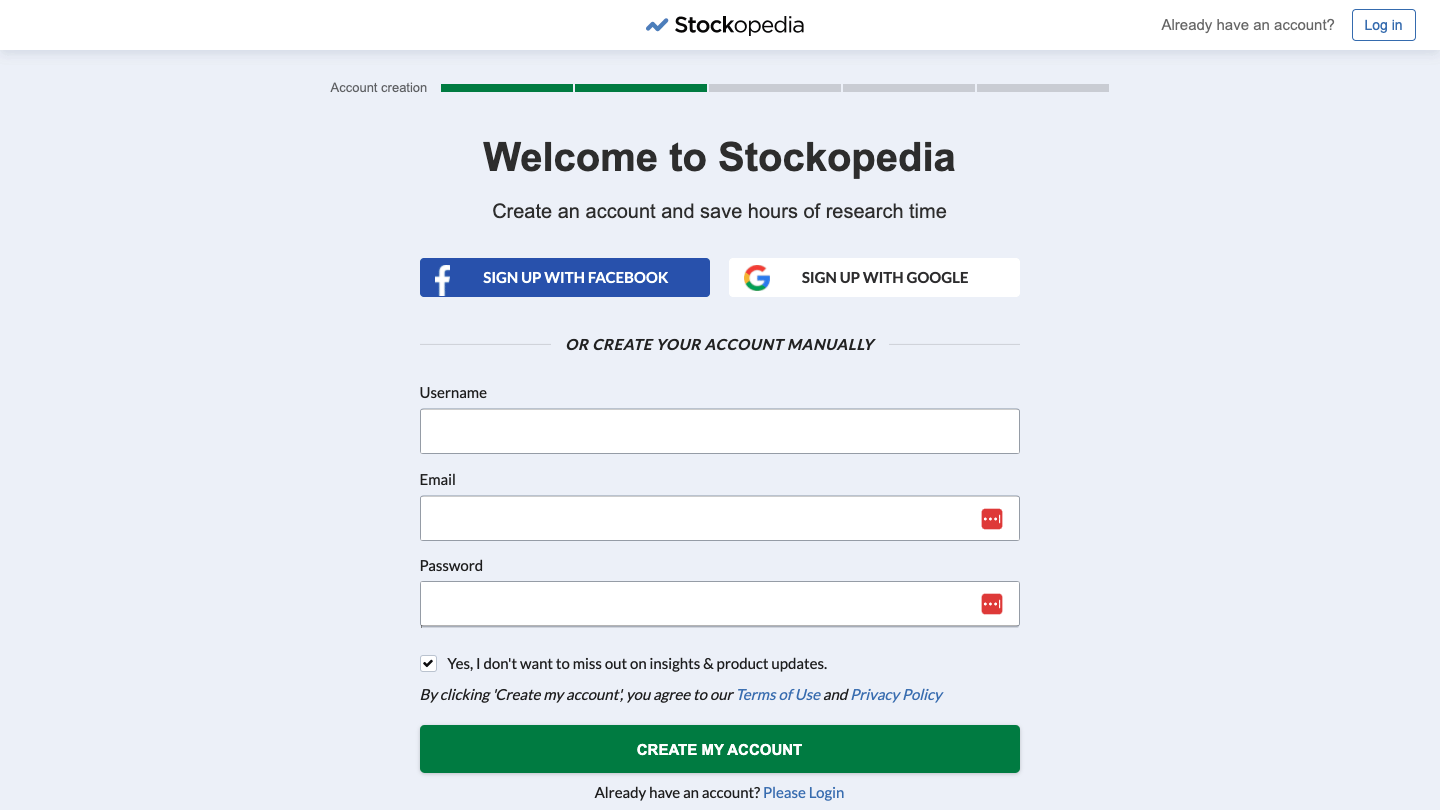
- We restructured the customer journey to put the plans page before the create account page. This ensured customers knew what they were signing up to.
- We introduced a “slow lane” for customer who weren’t ready to take out a trial. They could enter their email address to sign up to weekly editorial content.
Step 05.
A/B testing
We conducted an A/B test comparing the proposed variant to the current plans page. We saw a significant increase in average customer spend, which gave us the confidence to proceed.
